
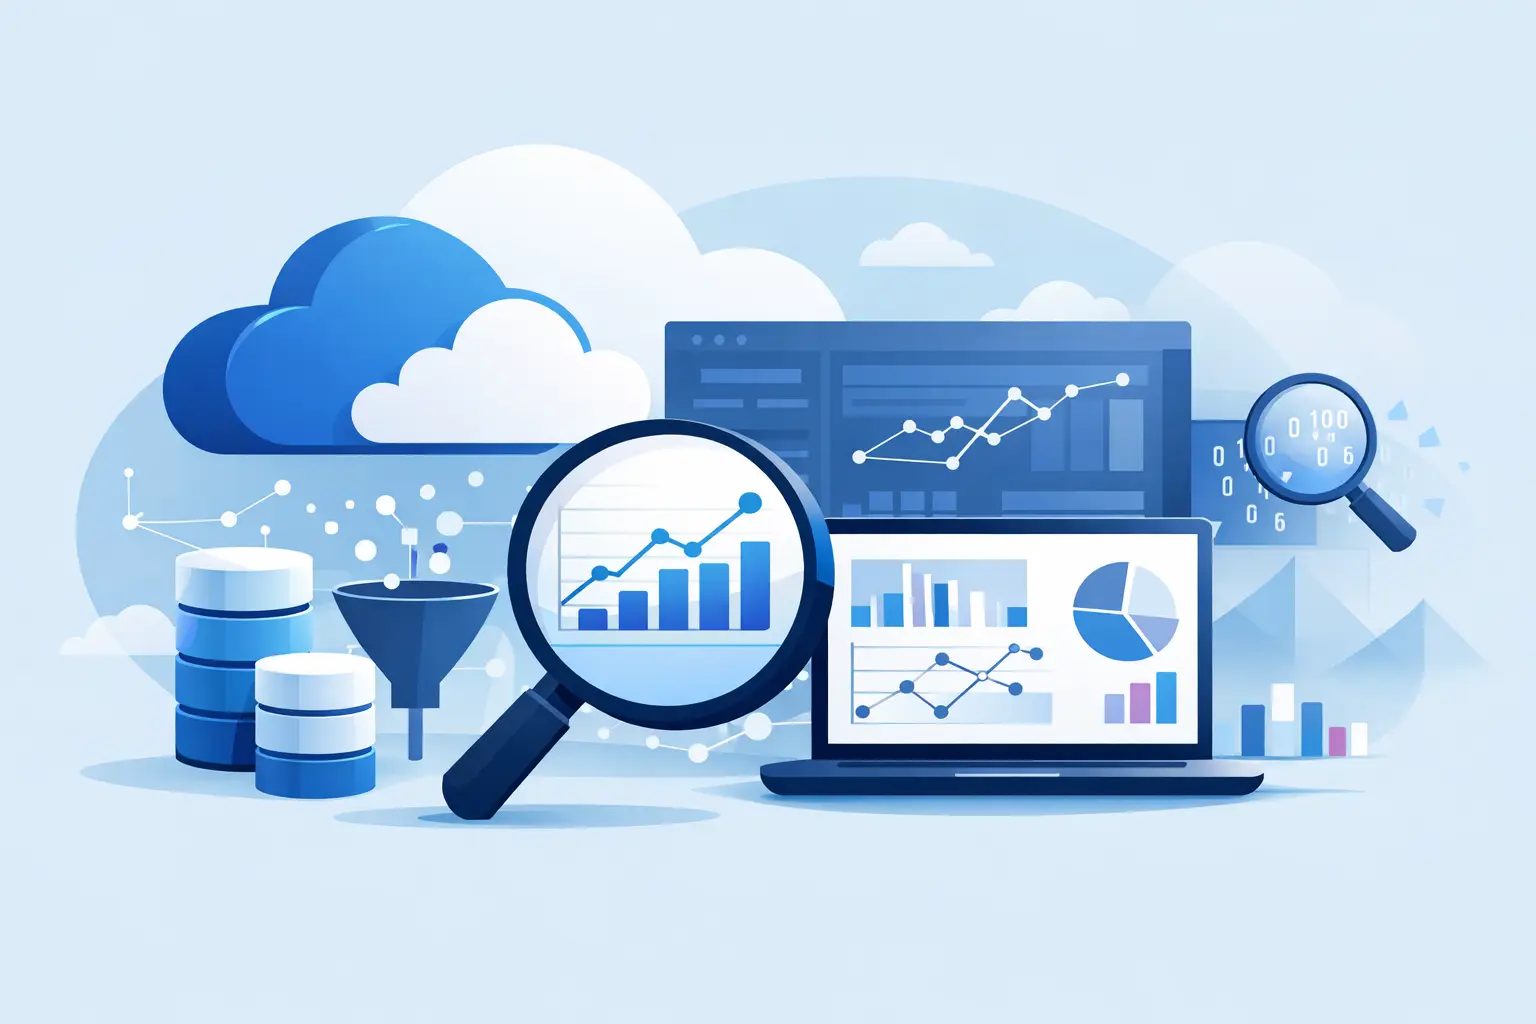
A production incident can generate millions of events before an engineer has finished opening a dashboard. The problem is rarely a lack of data. It is finding the few signals that explain what changed, who is affected, and where to investigate next. This Azure Data Explorer tutorial shows how to use Azure Data Explorer, often called ADX, to turn high-volume telemetry into answers with Kusto Query Language (KQL).
ADX is a managed analytics service built for log, metric, trace, and event analysis. It is particularly useful when data arrives continuously and analysts need interactive query performance across large time ranges. Think application telemetry, security events, IoT readings, infrastructure logs, product usage events, and operational audit trails.
When Azure Data Explorer Is the Right Tool
Azure Data Explorer is not a replacement for every database in an Azure architecture. It is optimized for append-heavy, time-oriented analytical workloads. You ingest data, retain it for a defined period, and run aggregations, filters, joins, and anomaly-oriented investigations over that data.
A transactional application that must update a customer record on every request is usually better served by a relational or operational database. A data warehouse may be a stronger fit for highly modeled business reporting across many systems. ADX earns its place when speed of investigation matters and the raw event stream is too large or too irregular for conventional reporting workflows.
For engineering teams, the practical advantage is that KQL lets you work from the question outward. You can start with “what errors spiked in the last hour?” and progressively narrow the query without first designing a complex schema for every possible investigation.
Azure Data Explorer Tutorial: Create the Foundation
An ADX environment has three core concepts: a cluster, a database, and tables. The cluster provides the managed compute and storage capacity. The database groups related data and policies. Tables hold the records you query.
Create an Azure Data Explorer cluster in the Azure portal, choosing a region close to the workloads that will send data and the teams that will query it. Capacity selection deserves thought. A small development environment is appropriate for learning and query prototyping, while a production cluster must account for ingestion volume, concurrency, retention, and response-time expectations. Start with measured demand where possible, because an oversized always-on cluster can become an expensive convenience.
After the cluster is ready, create a database such as `OperationsAnalytics`. Then create a table for a realistic event stream. This example uses application requests:
“`kusto .create table AppRequests ( Timestamp: datetime, ServiceName: string, Region: string, StatusCode: int, DurationMs: real, UserId: string, OperationId: string, Message: string ) “`
Each column should support a known analytical need. `Timestamp` drives time filtering, `ServiceName` and `Region` support segmentation, and `DurationMs` enables latency analysis. Avoid treating schema design as an afterthought. ADX can handle flexible data, but clean types and useful dimensions make queries clearer, cheaper, and easier for other engineers to reuse.
For experiments, you can ingest a small CSV or JSON file through the portal. In production, ingestion commonly comes from Event Hubs, Event Grid, Azure Storage, Azure Data Factory, or telemetry pipelines. Streaming sources fit near-real-time operational analysis, while batch ingestion can be more cost-effective for periodic data loads.
Start Querying with KQL
KQL is pipeline-based: each line takes the previous result and refines it. The pattern is readable once you recognize a few key operators: `where` filters rows, `project` selects columns, `summarize` aggregates values, `extend` creates calculated fields, and `order by` sorts results.
Begin with a narrow time filter. In large telemetry tables, filtering early is one of the simplest ways to improve both readability and performance.
“`kusto AppRequests | where Timestamp >= ago(24h) | where StatusCode >= 500 | project Timestamp, ServiceName, Region, StatusCode, DurationMs, OperationId, Message | order by Timestamp desc | take 100 “`
This returns recent server errors and enough context to begin correlation. The `take` operator is useful while exploring, but do not mistake it for a complete analysis. It returns an arbitrary subset unless the data has already been sorted.
Next, measure failures by service and time interval:
“`kusto AppRequests | where Timestamp >= ago(24h) | summarize FailedRequests = countif(StatusCode >= 500) by ServiceName, bin(Timestamp, 15m) | order by Timestamp asc | render timechart “`
The `bin()` function groups timestamps into regular windows. Fifteen minutes may be right for a daily trend, while one-minute bins are better for diagnosing a sudden deployment regression. Smaller windows provide more detail but can also make normal variation look alarming.
Latency analysis follows the same shape. Percentiles generally tell a more useful story than averages because a good average can hide a painful tail of slow requests.
“`kusto AppRequests | where Timestamp >= ago(6h) | summarize P50 = percentile(DurationMs, 50), P95 = percentile(DurationMs, 95), P99 = percentile(DurationMs, 99) by ServiceName, bin(Timestamp, 5m) | order by Timestamp asc | render timechart “`
A rising P95 with stable request volume may point to a downstream dependency, saturation, or a code-path change. If only one region is affected, add `Region` to the grouping before assuming the application service itself is at fault.
Build Queries That Support Investigation
The fastest KQL query is not always the most useful one. Operational queries should preserve enough context to move from an aggregate signal to the individual events behind it.
A strong workflow starts broad, identifies an unusual segment, then drills down. Suppose errors are concentrated in one service. You can inspect message patterns like this:
“`kusto AppRequests | where Timestamp >= ago(2h) | where ServiceName == “checkout-api” and StatusCode >= 500 | summarize ErrorCount = count() by Message | top 10 by ErrorCount desc “`
If your events contain a shared `OperationId`, use it to connect records across services. A join can correlate request failures with dependency telemetry, but joins have a cost. Filter both datasets to the relevant time range and keys before joining, especially when working with large tables.
For recurring logic, create functions rather than copying the same query into every workbook, alert, and incident note. A function such as `GetServiceErrors(serviceName, lookback)` establishes a shared definition of an error investigation. This reduces the quiet inconsistency that appears when every team member writes a slightly different filter.
Ingestion, Retention, and Cost Decisions
ADX is powerful partly because it can retain and query massive event volumes. That strength makes data discipline essential. Before connecting every source, decide which events need interactive analysis, how long they remain valuable, and which fields are needed for filtering or correlation.
Use retention policies to align storage duration with operational and compliance needs. High-detail debug events might be valuable for seven or 30 days, while summarized security or business events may need a much longer window. Consider ingestion-time transformations or upstream filtering when a source produces noisy fields that nobody queries.
Data type choices also affect query behavior. Store timestamps as `datetime`, numeric measurements as numeric types, and use `dynamic` intentionally for semi-structured payloads. A `dynamic` column is convenient for JSON, but repeatedly extracting values from it can make common queries harder to maintain. If a property becomes central to alerts or dashboards, promoting it to a typed column is often worthwhile.
Monitor ingestion failures and query patterns from the start. A query that works on a week of test data may be inefficient on six months of production telemetry. Make time filters standard, select only needed columns, and aggregate before expensive operations when the investigation permits it.
Turn Queries into Operational Views
A saved query becomes more valuable when it supports a repeatable decision. Use ADX dashboards or Azure Monitor workbooks to present a service health view with request volume, error rate, P95 latency, and regional breakdowns. Keep the dashboard focused on questions an on-call engineer or service owner must answer quickly.
Alerts should be tied to conditions that warrant action, not merely visible fluctuations. A fixed error-count threshold can work for a stable internal system. For a service with highly variable traffic, an error-rate threshold or a comparison to normal seasonal behavior may be more meaningful. Alert quality matters because noisy alerts train teams to ignore the signals that should prompt investigation.
Security and access control also belong in the design. Give people and automation the least privilege needed for their role, separate development and production access where appropriate, and treat query results as potentially sensitive. Telemetry can expose identifiers, request contents, infrastructure details, and behavior patterns even when it does not look like traditional customer data.
The most useful ADX setup is not the one with the most tables or the most elaborate dashboard. It is the one where an engineer can move from a production symptom to evidence quickly, confidently, and with enough context to make the next decision.